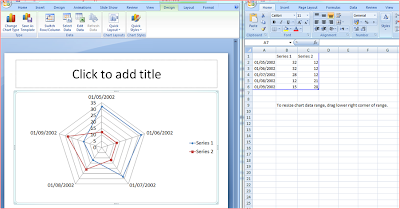
The spider chart is widely used in Agile implementation and personal coaching sessions. This chart enables teams or individuals to understand their status and set their goals accordingly.The spider chart is only the first step to identify and set the goals. Tracking the goals is done with Kanban or Scrum tools.
Here is how we do it:
The spider/radar chart is a graphical method of displaying multivariate data in the form of a two-dimensional chart of three or more quantitative variables represented on axes starting from the same point. The relative position and angle of the axes is typically uninformative.From Wikipedia
I know that we all agree that setting goals helps you improve personally and professionally.So let’s start setting them and make sure we will know how to archive them afterwards.
Each point represents an issue or goal we wish to deal with.We grade our goals twice: Firstly, as they are today, and secondly, as we want them to be in the future.
For example:
List areas in your personal life that you want to address.
For example:
- Money
- Relationship
- kids
- Hobbies
- Friends
Remember, keep things simple. Five issues is probably enough
for the first chart.
Now, grade the satisfaction level you feel for each area listed as it is today.
In this case, I graded an 8 for how satisfied I feel with my friends, but a 3 for how satisfied I am about the relationship with my kids.When you’ve finished grading, connect the dots.
Look at the spider chart
and begin asking some questions.
For example :
- What is your strongest area?
- What is your weakest area?
- Is this the state you like to be in?
- Where do you like to be?
- What areas you wish to improve?
Set future goals:
Review each area and ask yourself how would you like to grade it in a month?Imagine what every area will look like, and write it down along with the grade you wish to archive.
Remember, the grade reflects your goal!
Think about long term and short term goals. We can set both, of course, but for the sake of example, let’s look at the short term goals .
Mark your future grades on the chart (use a different color so you can tell the difference), then connect the dots.
To start achieving the goals:
Look at the gap between what happens today to what you want to do, and list the things you think you should do to bridge the gap.
- Pick one or two areas.
- For each area, ask yourself, ‘what will make my grade improve from 1.5 to 3’ ? What practical actions do I need to take to make this happen?
List one or two things as an objective for the coming week, and add it to your task board (you do have a task board, right?) Remember successful change is achieved when you set a realistic goal with small maintainable steps that can be executed in a one day. If you want to set long term goals, measure your progress by dividing the long term goal into smaller steps.
A realistic task toward reaching my goal can be
Every task you set should hold a value toward achieving the grade you have set.You can put more tasks in your backlog, but as always in Agile, keep it simple. Limit yourself to a few tasks a day.
- Take the kid to the park
- Read him a book
- Go with my husband on a date
Go : Now all you have to do , is set your board as ready , an off you go to perform your tasks.
Daily session: Monitor
your progress daily by reviewing your task board.
Once a task is done , go
on to the next in line.
At the end of every week, take
another look at your spider.
Look at the results and ask
yourself, ‘How did it go?’
What should I do better
next week?
What should I keep on
doing?
You can also think about
all the things you did and are going to do, how they impact your life, and
decide if you like to change your schedule and add some of those activities as
permanent ones to your day to day activities.
Inspect your grade again.
Don’t forget to have
fun. Fun is a powerful tool when you want to get things done.
Working with a coach is easier, but if you want to get started by yourself - I think working with a spider chart and a task board is a good way. The spider chart can be used with groups of people, or to identify project areas of improvement, with kids, manager’s personal development, teachers and many more. By the way, you can create a digital spider chart with Microsoft PowerPoint. Just go to Menu: Insert ->charts -> radar. The chart will open with default area for data inserting. Just fill out the data and off you go :)
Enjoy !
- http://en.wikipedia.org/wiki/Radar_chart
- Star Plots - Statistical Graphics for Multivariate Data
- Spider Graphs: Charting Basketball Statistics


No comments:
Post a Comment